Analyzing Steam Reviews and Users Data
I don’t know about you, but most of my recreational time ends up going to video games. So when I started learning data science and finding what data is out there that I could check out, of course I jumped onto the chance to analyze video game data! I found two datasets on Kaggle, one with Steam review data and another with Steam user data. In case you’re unfamiliar, Steam is the largest platform for PC gaming, with thousands of games and millions of users. Analyzing each dataset is interesting enough, but I also wanted to see what insights I could pull from the two combined. So let’s dive in!
The Reviews Data
Source: https://www.kaggle.com/luthfim/steam-reviews-dataset
This data has a whopping 434,891 reviews in it! Steam reviews either recommend a game or not, so there’s no 5 or 10 star ratings here. They do have the review text in this data, as well as counts of how many hours the reviewer has played and how many other users said they found the review funny or helpful.
While the review text is interesting to us as people, it is meaningless to most programs and I am not at the point of trying to build a program that can understand it yet. Maybe that can be a project for another time, but here I ignore the review text. I do however keep in mind the length of the review, in number of characters.
This dataset ended up having reviews on 48 different games. However on closer inspection I found 23 of the games only had either 3 or 10 reviews. That’s not a great sample size, so I will keep that in mind later. The other 25 games all had at least 150 reviews, up to over 145,000 reviews for the most common game.
Review Playtime
A reasonable assumption might be that players will play games they like more than ones they don’t like. So does this data support that?
Just looking at the average hours played in each game vs how often the reviewers recommended it, the correlation is actually pretty low. Specifically, there is only a correlation coefficient of -.069 when including all games, or -.353 when considering the games with more than 10 reviews. (Remember, sample size matters!)
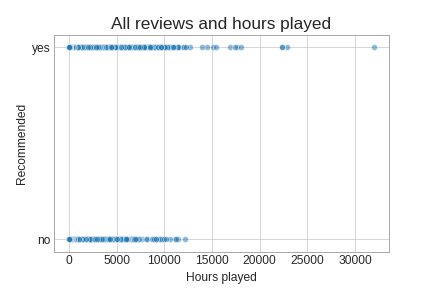
If you look at the playtime of all reviews like this, it does appear there is a cutoff where players who did not recommend a game stopped playing altogether. However, notice that cutoff is around 12,500 hours! There also isn’t very many reviews with more hours than that.
Looking at the specific numbers, the median playtime on these reviews is 190 hours, and the average is 364 hours. Let’s take that median and say that’s “a lot” of time (and to people who don’t play a lot of games, yeah that is a lot).
- 217,720 reviewers have played over 190 hours, and they recommend the game 73.23 % of the time
- 217,171 reviewers have played under 190 hours, and they recommend the game 66.38 % of the time
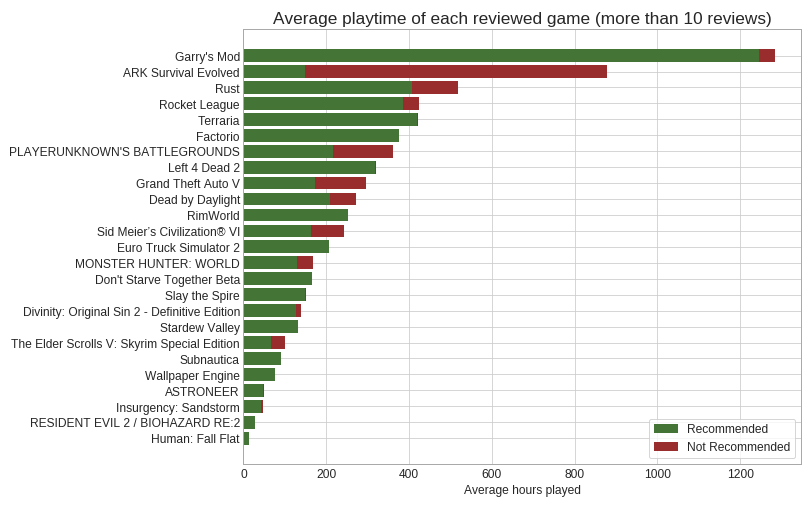
For the record, those percentages are almost the same if you make the cutoff 364 instead. So while there is a difference between how long people will play games that they like or not, it is surprisingly small. This brings up an interesting point though, of just how many hours players have put into these games. So here’s a visualization of the hours played in each of the games we have more than 10 reviews for.
And one last note, it turns out there were 6,258 reviews in this data that had 0 hours played. Not a lot compared to the 434 thousand total, but it is interesting.
Review Length
While I am not at the point of getting meaning from text data, I did wonder if there were any relationships to just how long the review is. In other words, are people more likely to write longer positive or negative reviews?
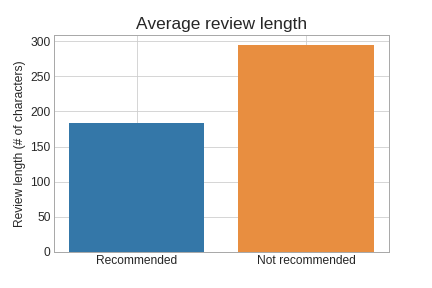
Turns out, there is a difference! The positive reviews have an average length of 184 characters, while negative reviews have an average of 295. So perhaps people get more wordy when they’re unhappy? There is a common concept that people are far more likely to leave a review on a negative experience than on a positive one, so perhaps this is an extension of that.
Additionally, we also had data on if reviews were found funny or helpful by other users. Does that relate to the review length?

Looks like there is not a relation there. Specifically, we only had correlations of .034 to funny votes, and .063 to helpful votes. So it turns out that the length of a comment really doesn’t tell us if people might find it funny or helpful.
The Users Data
Source: https://www.kaggle.com/tamber/steam-video-games
This data is a little simpler. Each row includes an anonymized user id, the game owned, and how many hours they have played in that game. This data is particularly interesting because Steam changed their policies a couple years ago and closed public access to individual user data like this.
I ended up with 129,535 instances of a user owning some game, 12,393 different users, and 5155 different games. So this data is a bit more general than the 48 games we had reviews for. On average each user owned 10.45 games, ranging from just 1 game owned to 1075.
Bought but not played
One interesting thing here is the number of users who own a game but never play it. By simply looking for how many rows have 0 hours played, I can see that on average each user plays 72% of the games they own. Anecdotally, that seems pretty accurate. I’ve actually only played roughly half of the games in my library because of random games I’ve picked up from sales and bundles.

Additionally, 1,043 of the users in this data have not played any of the games they own. Your guess why is as good as mine on that one.
Playtime
Of course the other side of that question is just how many hours have people played? Well in this data, the average across all users is 278.5 hours. That sounds like a lot, but keep in mind that’s a lifetime statistic.
Looking at that data from the game perspective instead of the user, each of the 5155 games was owned by an average of 25 people, and had an average of 669.7 total hours played. Further, 1555 of the games in this set were owned but never played at all.
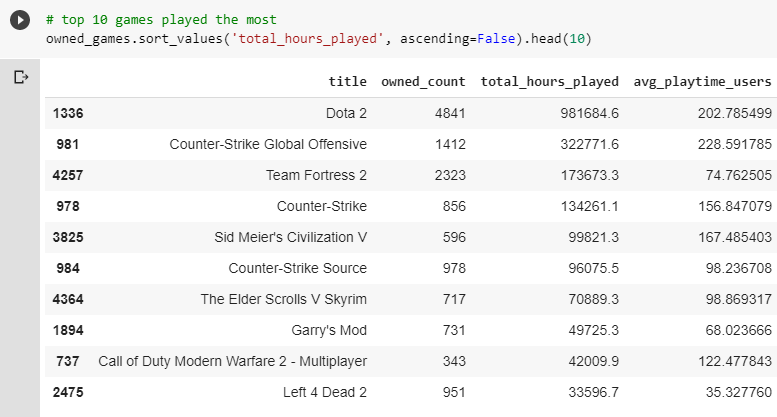
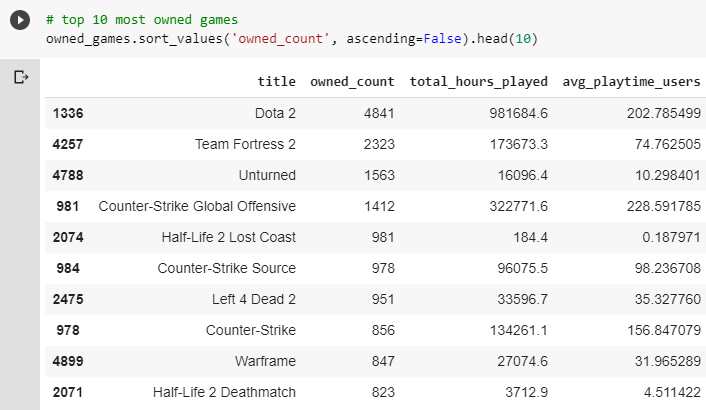
Since there’s not as much relational data in this set, here’s a couple top 10 lists:

I guess some people really like their sports games!
Combining Sets
All of that so far is interesting, but what I had really wanted was to see what both sets together could tell me. That starts with finding the common ground between them.
Just doing simple comparison, I only found 8 games that were common between the two datasets. I dug a bit further with some similarity comparisons, and found 4 more for a total of 12 games. Since that is all I found, at least I can easily show it all here.

I had really hoped to find more, but while comparing different games I found why there was so little overlap. The two sets were taken from different time periods! While the first set had reviews ranging from December 2010 through February 2019, the games it had were mostly recent releases. The second dataset didn’t mention any time period at all in its description, but the games it includes show that it was a bit older. For example, the first set included Football Manager 2019, while the second dataset had entries for each of the Football Manager games from 2009-2016. So while 12 games is far too low of a sample size to draw any definitive conclusions, we can at least look at some of the relationships here.
Average playtime of reviewers vs all players
Do players who leave reviews for games play more than those that don’t?
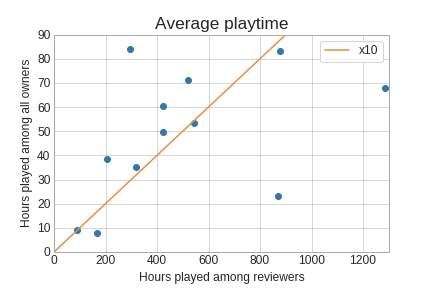
Well it certainly looks like they do. In fact, many of the reviewers played ten times more than all players, shown by the orange line. Keep in mind though, that this is only 12 games out of the thousands on Steam. Also, since we know the reviews data is more recent, perhaps those players have simply had more time to play.
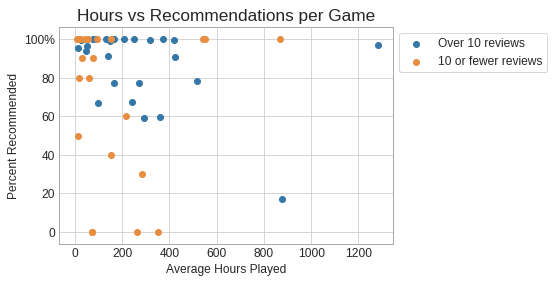
Recommendations vs hours played
Earlier we looked for a relationship between how long reviewers played and how much it was recommended. There was not a strong relationship there, but is that true when looking at the playtime of all users?
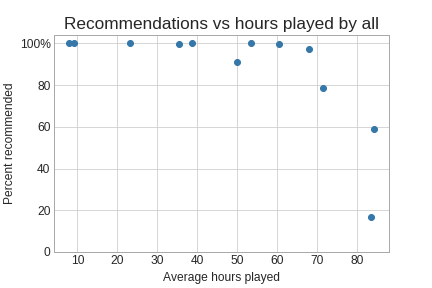
This actually shows the opposite of what we had before. When just looking at reviewer playtime, we saw that players who played more were slightly more likely to recommend their games. But out of the 12 games we had in common, the only 3 games with less than 90% recommendations were also the three most played on average. It would definitely be interesting to check this again with more complete data.
Final thoughts
So I was not able to find some of the cool cross-dataset insights I was hoping for. This still showed some interesting things, and even challenged my assumption that people who didn’t recommend a game weren’t likely to play it much. Steam no longer makes user data as accessible as it used to, but I would definitely like to revisit these observations if I can get more complete and up to date data.
You can read this story on Medium as well!
And last but not least, here is my jupyter notebook where you can see my raw work: https://github.com/jonDuke/jonDuke.github.io/blob/master/notebooks/Steam_Data_Analysis.ipynb