Attempting to predict League of Legends match outcomes
Now that I’m learning how to do predictive modeling, I start to look at many things and ask “can this be predicted or not”? So when I found a dataset of about 50 thousand League of Legends matches, I decided to give it a try. I’ll save you the long read and say it here: I was not successful. I was still able to get a few insights though, so read on to see how it was all done and what I did learn.
The game
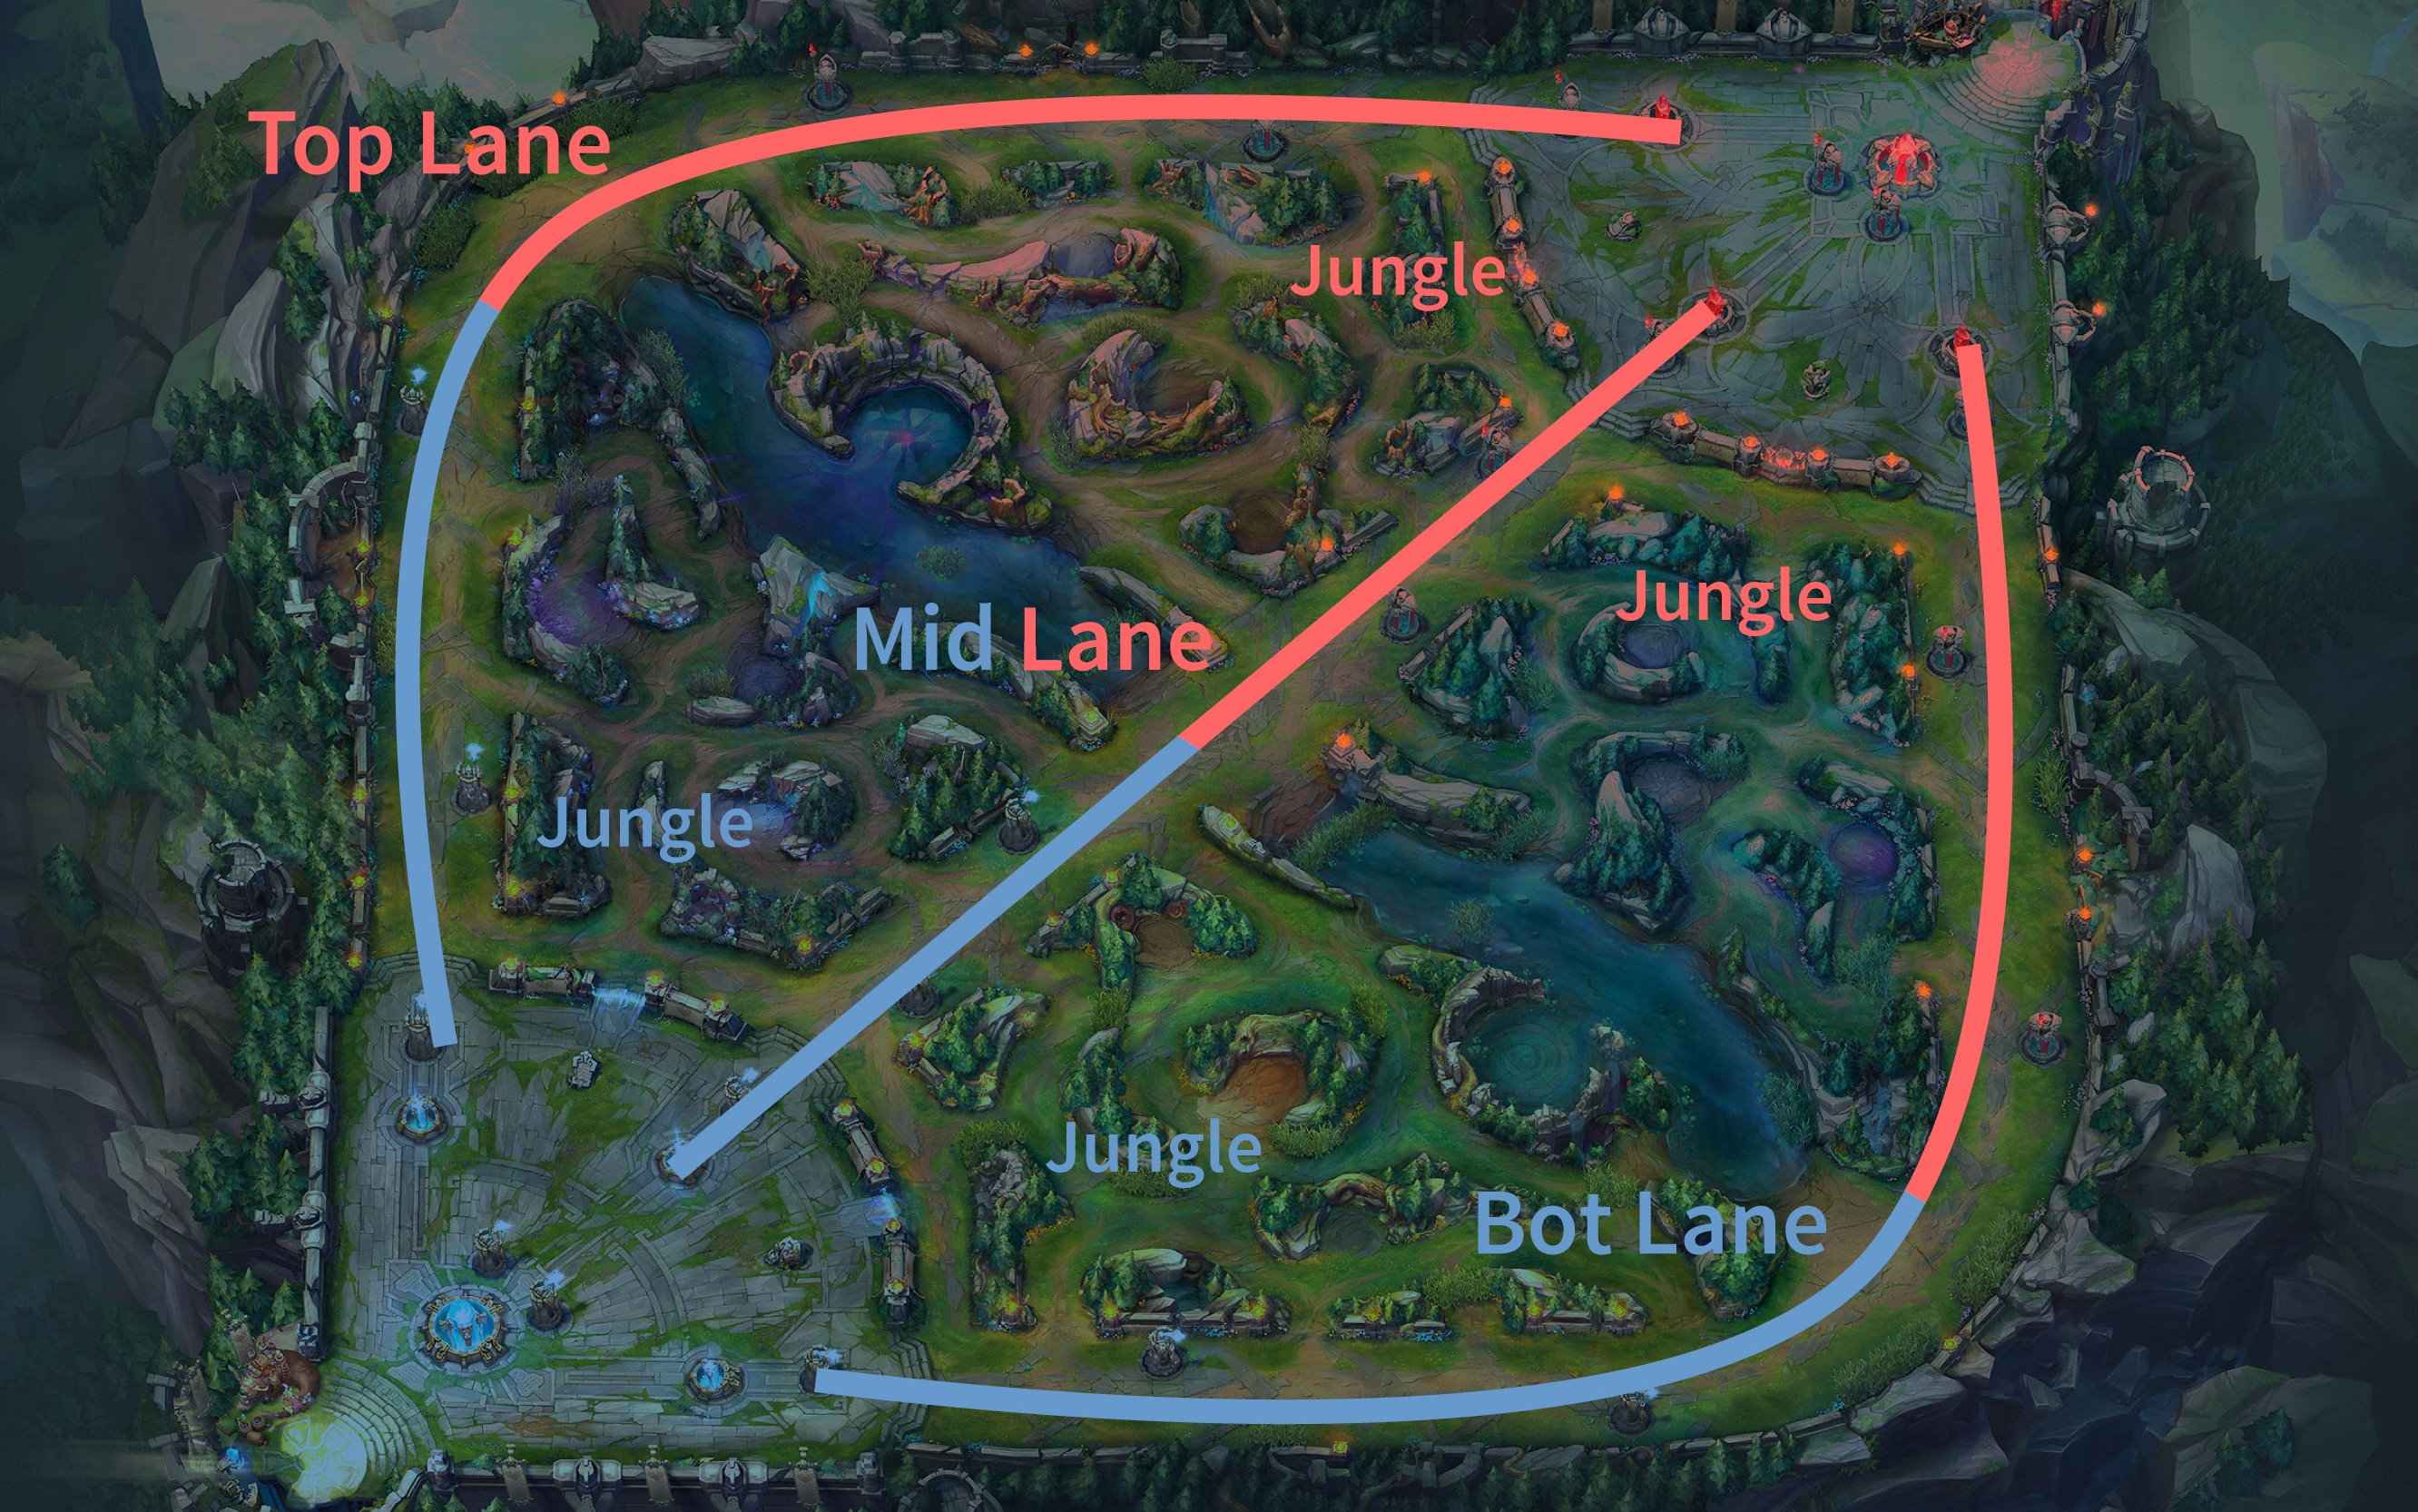
First, let me explain a bit about the game for those who are not familiar. League of Legends (a.k.a. League or LoL) is a team-based strategy action game where two teams of 5 battle against each other. The game itself has been around since 2009, and is still popular to this day. In fact, it is one of the top e-sports games out there, and has international tournaments with millions of dollars in prize money. These finales can even get more viewers than the Super Bowl.
Each of the 10 players picks one of over a hundred unique champions, all with their own abilities and stats. The main goal is to fight your way into the other team’s base and destroy their nexus (the big building in the back of each side).
There are many different strategies that teams can use to win, but since there are so many champions to choose from I wanted to focus on that with my predictions.
The data
The original dataset can be found on Kaggle: https://www.kaggle.com/datasnaek/league-of-legends
While it would be possible to get this same data from the official API, having a dump of 50 thousand matches is really convenient. It does give me an important limitation though: this data is a couple years old. Leauge is constantly tweaked and rebalanced to keep things fair, so any predictions here may not exactly work on today’s game. The biggest difference is the number of champions: this data includes 138 different champions, but today there are 148 of them.
Let’s look at the data itself:
I have already performed a train/validate/test split here, so the training set seen is about 36k of the total 51k rows.
I am considering this data in two categories: pre-match and post-match. Pre-match data is what we know before the match starts, mainly which champions and spells are picked. Post-match data is statistics we get during or after the match, such as the game duration and number of kills. For my predictions, I am only using pre-match data since I want to predict the winner ahead of time.
For fun I did try some other columns and found that even simple default models could predict the winner more than 90% of the time when given post-match data. Even just the columns ‘t1_towerKills’ and ‘t2_towerKills’ resulted in 95% accuracy. However, this simply tells us that when one team wins, they generally destroy more towers than the other team. One does not necessarily cause the other. Insights like this are interesting but were not the focus of this project so I moved on to just the data I could use.
Finding statistics
While I could potentially run a model by putting in only the champions each player picked, I wanted to get some better statistics that I could also use as features. Statistics like pick rates and win rates are commonly tracked by others who analyze League data, but I calculated my own in this case using the matches in my train and validation datasets.
The last column is the only exception, while there are places I could pull the info automatically, I just manually looked that up for this project. It represents the most common roles each champion is used in.
The pick, ban, and win count and rate columns simply show how often each champion was picked by a player, banned by a player, or won a match they were in. And the baron and dragon columns give the average number of baron and dragon kills that teams got when this champion was on that team.
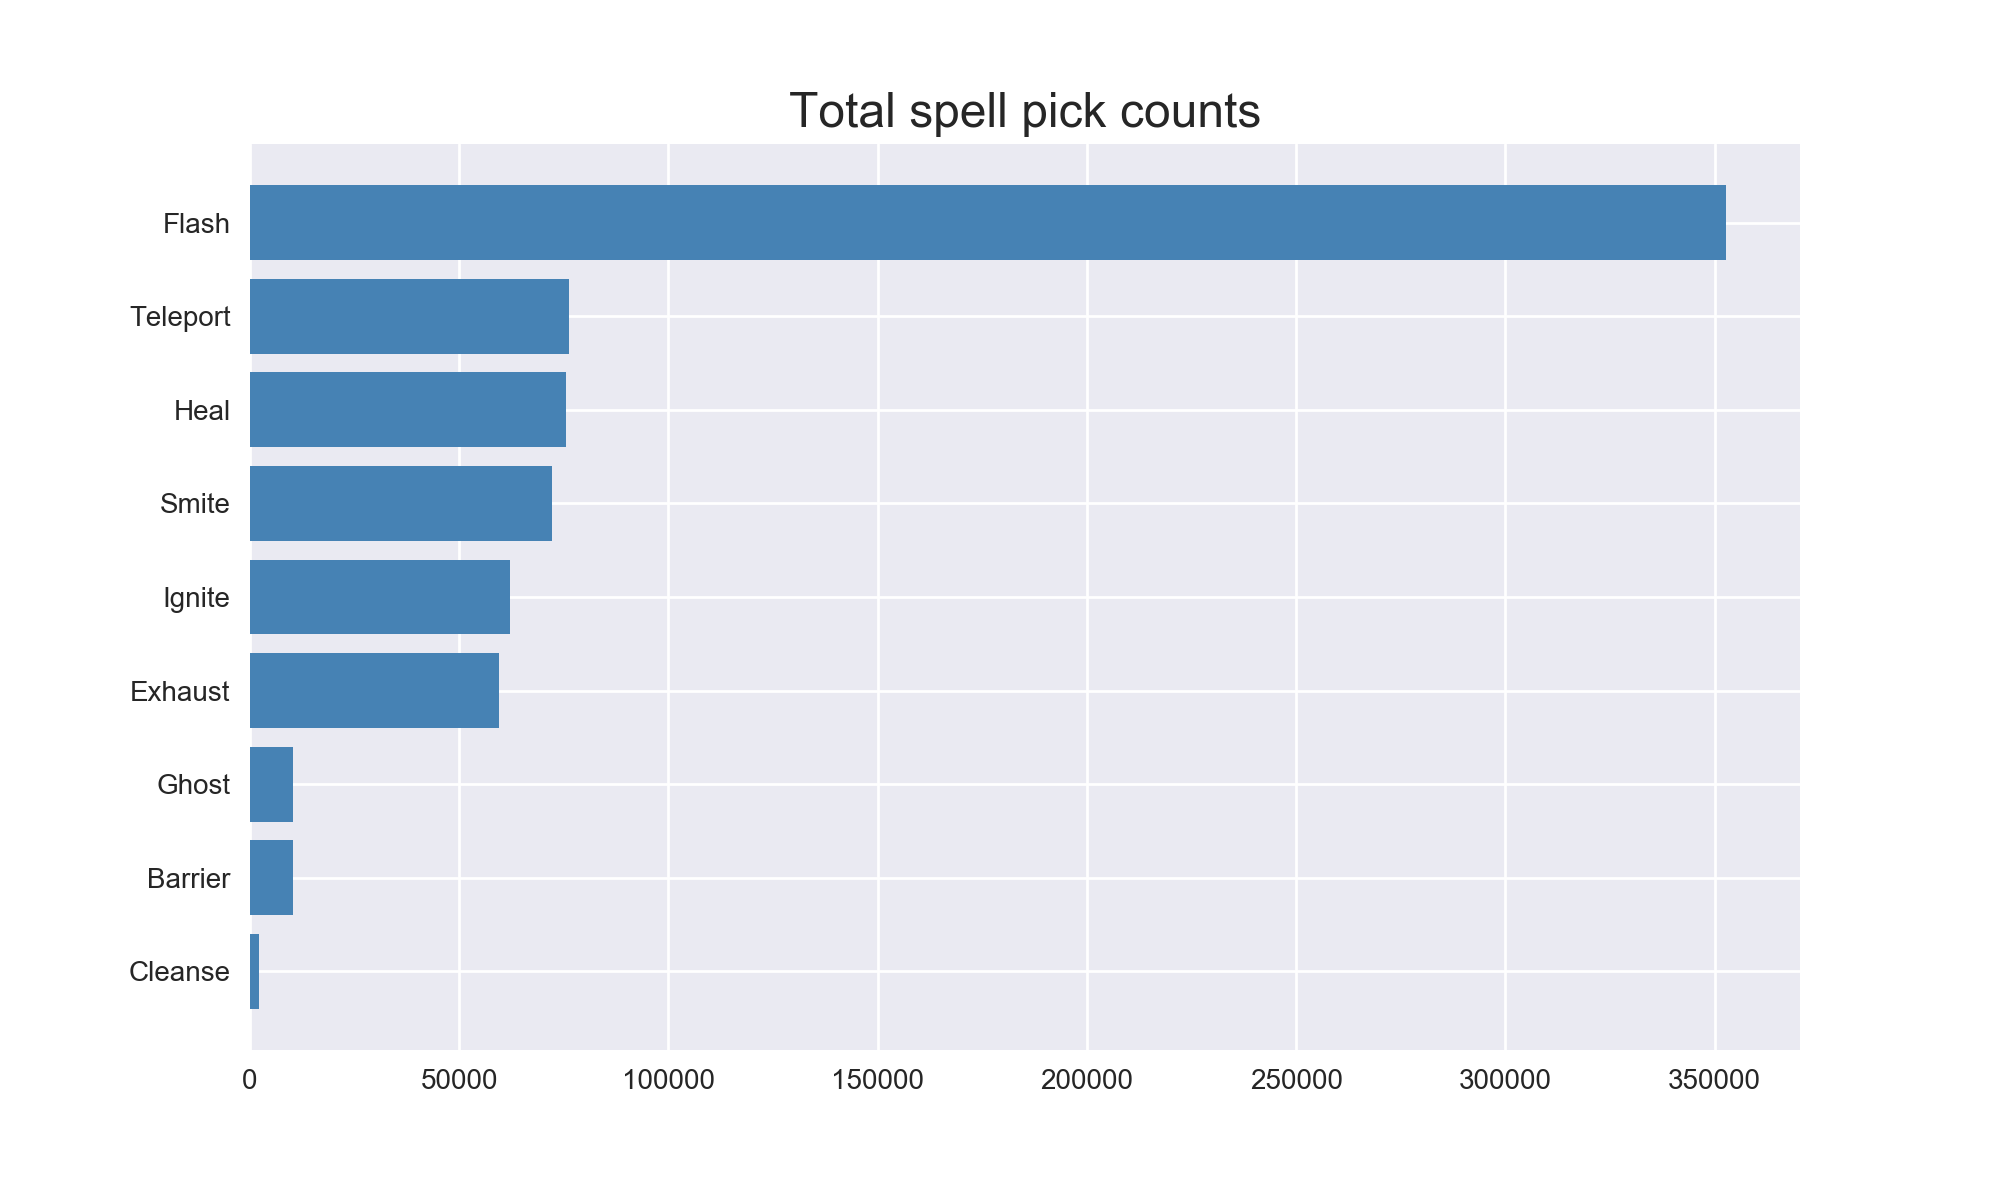
Since there are only 9 spells in the game, I did not spend much time on them. I did chart how often they were all used though. Remember that each of the 10 players gets to pick 2 spells.
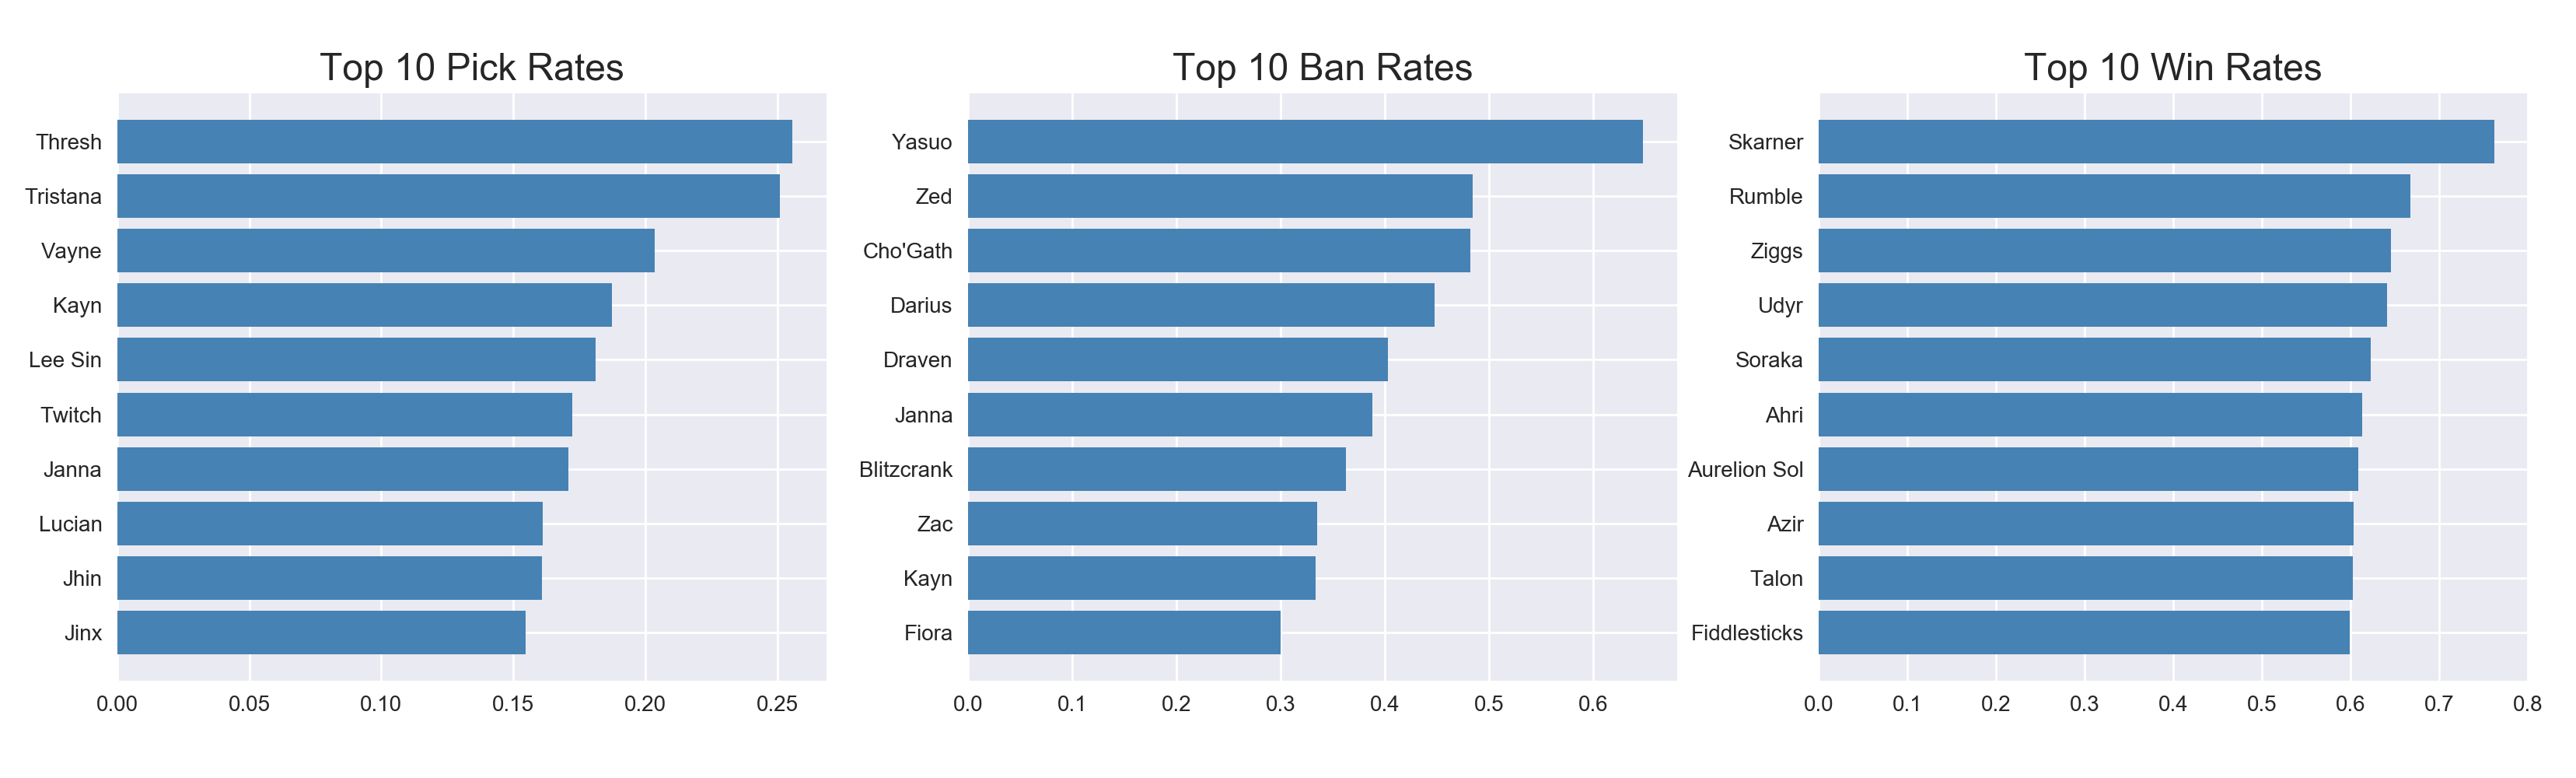
And of course who doesn’t love some top 10 lists. Here’s the top champions for pick, ban, and win rates.
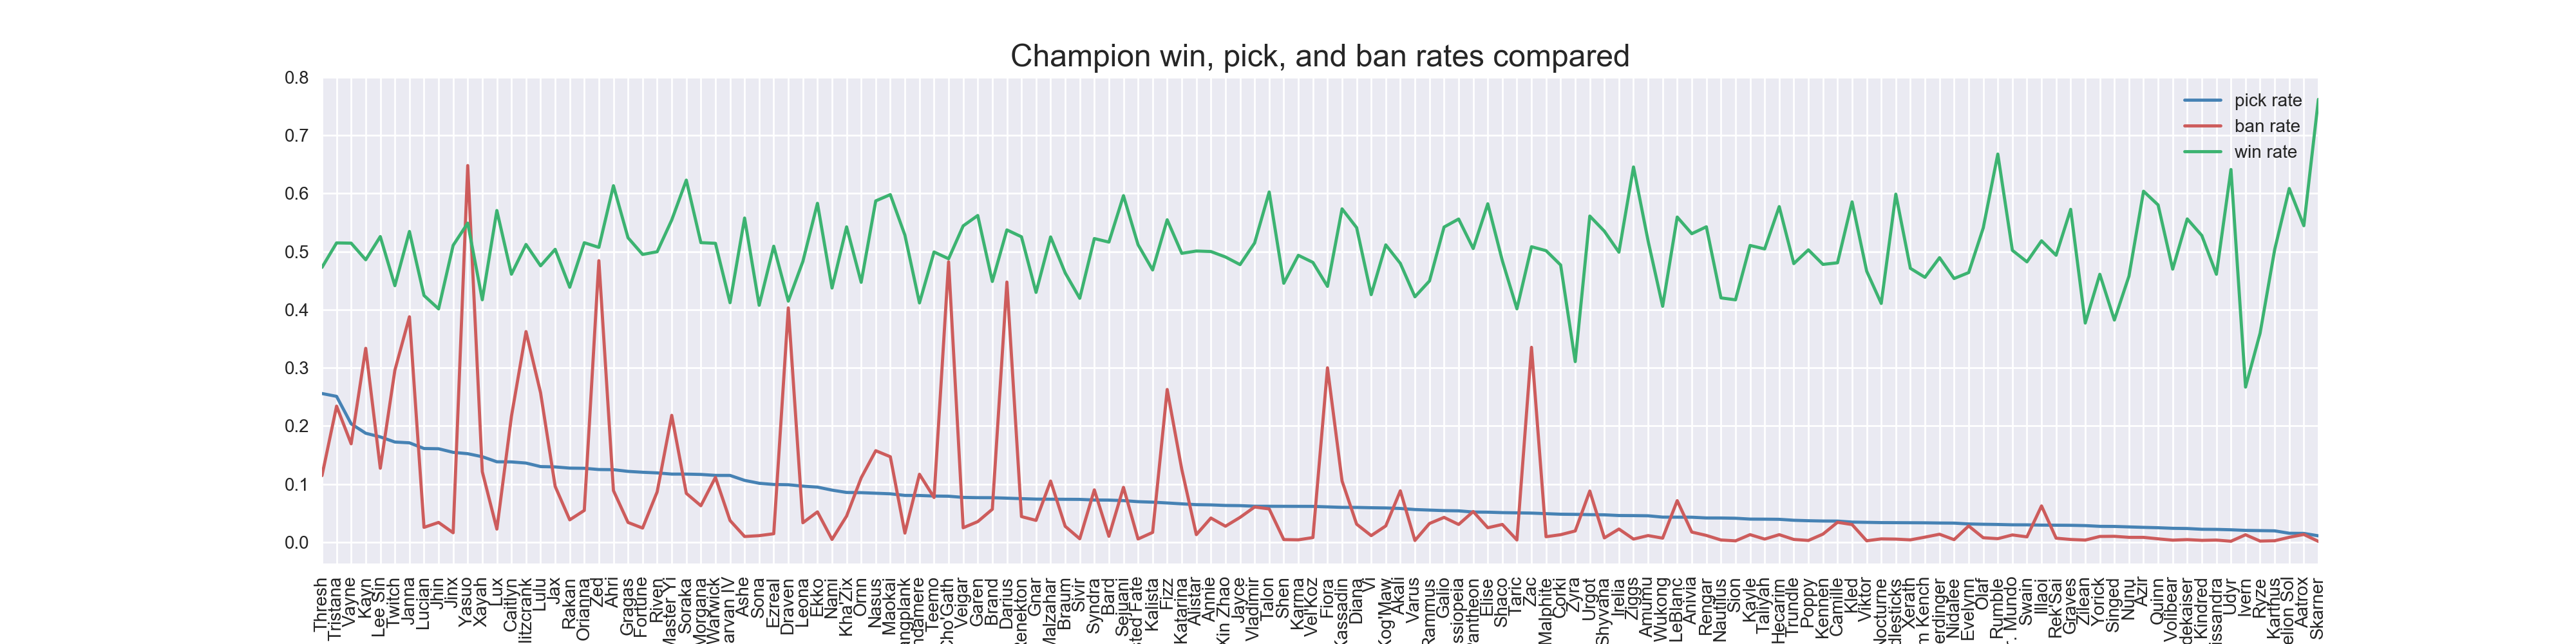
Interestingly, those rates aren’t strongly correlated with each other. By graphing them as seen below, we can see that the pick and ban rates are only loosely related and have a lot of variance, while win rates are fairly consistent across the whole roster. It was also interesting to find the outlier that the least picked champion also had the highest win rate (in these matches, at least).
Feature engineering
Now that I had those statistics, I could apply them to my pre-game data and generate some more information about each match. For each of the different statistics I had, I calculated the average of the 5 champions on each team to get an overall statistic for that team. I also calculated the difference between the teams’ statistics so I could directly compare them. Lastly, using the roles that I looked up I added a feature to tell if each team had one of each of the 5 roles (the ‘meta’ columns). Note that this is only an approximation since many champions are viable in more than one role and I only recorded their most popular one.
Once I had done that, I had some numerical data I could explore. I split my training data by which team won, and made more visualizations. This was where I got my first clue that this would be difficult to predict.
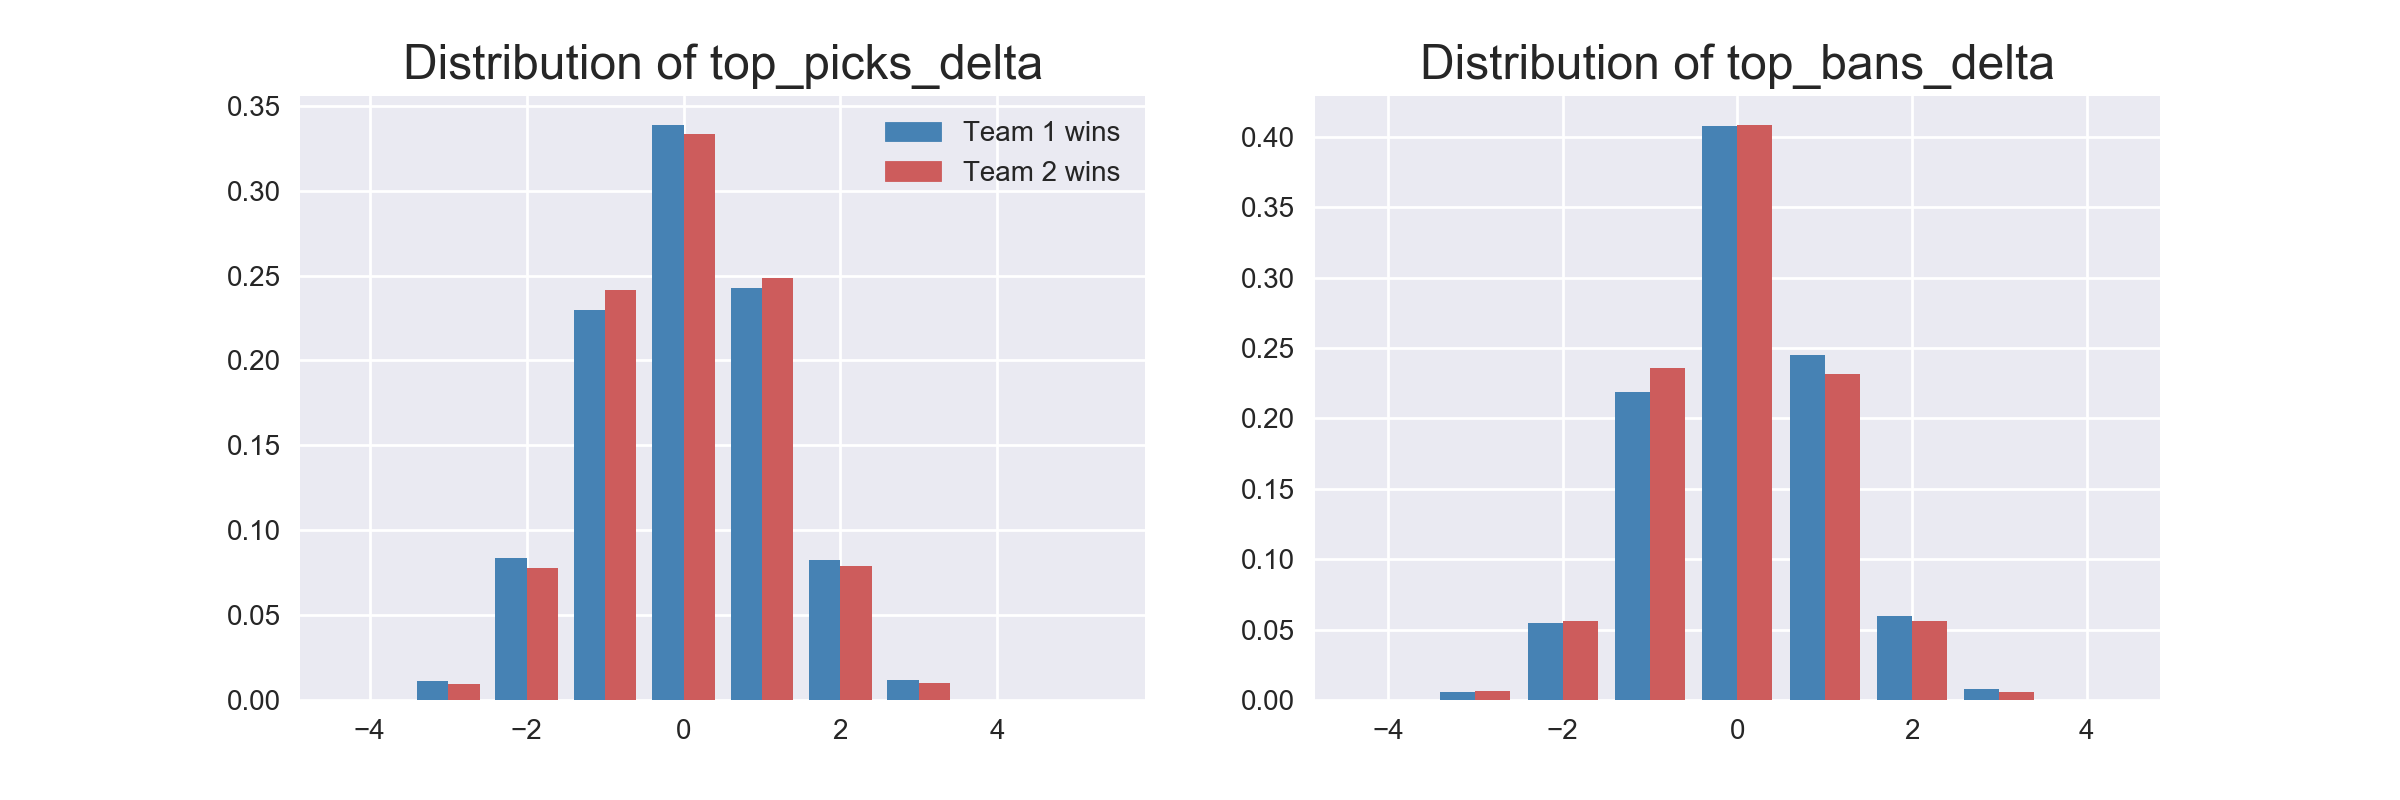
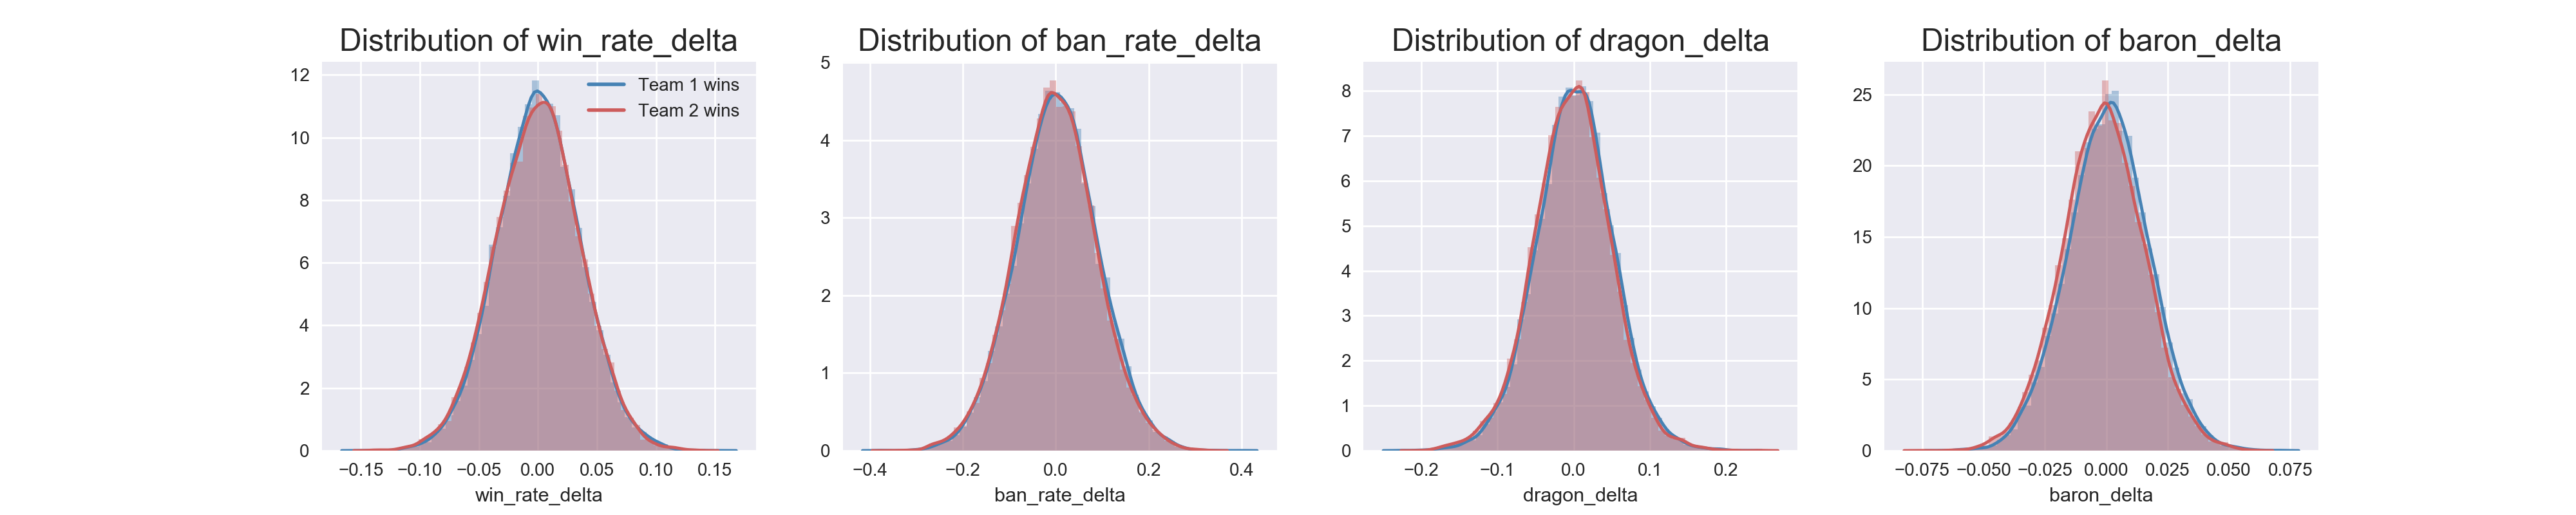
Even after going so far to calculate individual champion statistics and apply them to the teams in each of the matches, every feature I had was distributed the same regardless of which team won. This meant that none of them would end up being very strong predictors. But I came this far already, so it was time to actually try predicting things.
Models and Predictions
The first place to start with any predictive modeling project is to find a baseline. In my training data, team 1 won 51% of the matches, so that became my majority baseline.
Since I am still new to predictive modeling and wanted to learn more, I decided to try many different things to get a feel for how they all worked. In the end I picked 4 sets of features, 6 models, and 8 encoding methods, then ran all of them with (mostly) default hyperparameters and recorded the results.
The feature sets I chose were as follows:
- All available features (all pre-game data and all engineered features)
- Handpicked features (the 10 champions picked on each side, and 8 of the engineered features)
- Champions picked (just the 10 champions picked)
- Engineered features (just the 20 engineered features I ended up with)
The models and encoders are all from Scikit Learn, more info can be found here
- https://scikit-learn.org/stable/supervised_learning.html
- https://contrib.scikit-learn.org/categorical-encoding/
And while I could print out tables of all the results, it’s easier to show it all in this handy graph:
It was interesting to see Logistic Regression perform so well here. With the abundance of categorical data, I expected tree-based models to perform better. Categorical Naive-Bayes was also an interesting find. Since it could not take negative numbers as input (I could not find that in documentation, but the errors were very specific), the only data I passed to that one was the champions picked.
As you can see by the actual accuracy numbers though, none of the models are very good at predicting the winner. Though technically I did beat the majority baseline with each of them, depending on the encoder and features used.
I followed this up by selecting a few of the top models and used sklearn’s GridSearchCV for both hyperparameter optimization and cross-validation. The models I chose did end up with higher scores than the default settings shown in that graph, but not by much. I used the handpicked feature set on all except the last one.
- Logistic Regression with the LeaveOneOutEncoder
- This was my best result using default hyperparameters, and still my best after optimization.
- Cross-validation accuracy: 53.70%
- Final test accuracy: 53.53%
- Gaussian Naive-Bayes with the MEstimateEncoder
- This one was my second strongest model both in the default search and after optimization.
- Cross-validation accuracy: 53.43%
- Final test accuracy: 53.94%
- Random Forest with the JamesSteinEncoder
- While it wasn’t the strongest in my default search, I wanted to see how it performed after optimization. It improved, but is still behind the other models.
- Cross-validation accuracy: 53.22%
- Categorical Naive-Bayes with the OrdinalEncoder
- The graph doesn’t show it, but all encoders got the same 49% score except for Ordinal. So even though it doesn’t make as much sense for unordered categorical data such as champion names, I used it here.
- This model only used the 10 champions picked.
- Cross-validation accuracy: 53.22%
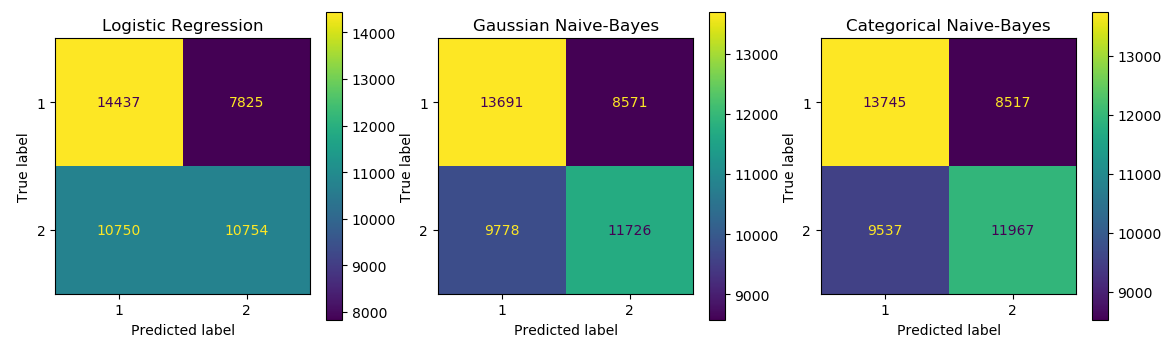
Now that I had some models, I could get a few more visualizations as well. I started with simple confusion matrices. They do at least show that we’re not simply picking one team all the time, and that the models are attempting to guess.
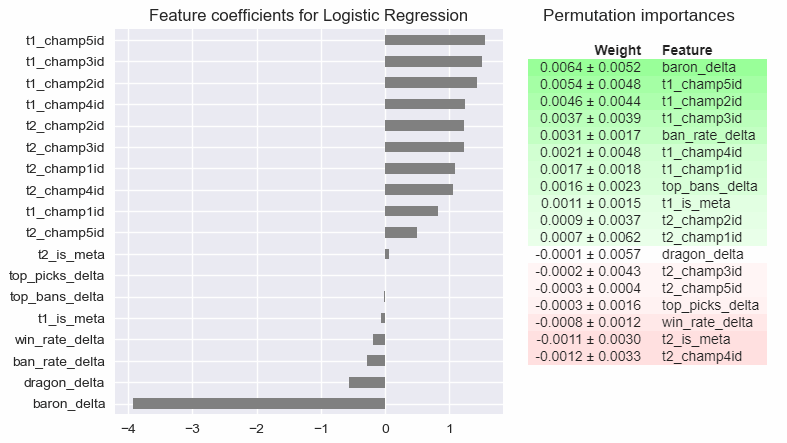
To look at individual features, I pulled the feature coefficients for the logistic regression model, and calculated permutation importances for the random forest model. The both show that most features have low importance values, though for what it’s worth the baron_delta feature was my strongest predictor.
Conclusions
As you can see, even with all the extra statistical analysis I threw in I still could not confidently predict the outcome. No matter which champions each team picked, they still had even odds of winning.
In a way, this is a testament to how well-designed this game is. Balancing unique characters so that they are all viable is no easy task, and this game manages to do it with over 100 of them.
In the end, it is the skill and teamwork of the players themselves that decide a match. And maybe a bit of luck.
You can view the source notebook where I ran these models here: https://github.com/jonDuke/DS-Unit-2-Build-Week/blob/master/Unit_2_LoL_Project.ipynb